
Table of contents
1. Adobe Analytics

Features
The platform uses machine learning, artificial intelligence, and other modern data analysis to deliver faster and more accurate customer insights:
- Ad hoc analysis: The Analysis Workspace offers a robust, flexible canvas for building custom analysis projects. Users can drag and drop any number of data tables, visualizations, and components (channels, dimensions, metrics, segments, and time granularities) to a project.
- Flow analysis: Show where visitors left or continued through a predefined sequence of pages. Its visualizations allow users to compare segments, rearrange funnel steps, mix and match values, and more.
- Advanced segmentation: Users can discover the most statistically significant differences among an unlimited number of segments through an automated analysis of every metric and dimension. Automatically uncover key characteristics of the segments that are driving results.
Pricing
The platform uses a custom pricing scheme that can average from $30,000 to $100,000 per year.
2. Heap

Features
- Funnels: Increase conversion by comparing funnels across different user segments, device types, or attribution channels. Measure the effectiveness of your A/B tests – automatically capture experimentation variation data, device type, ad campaigns, and more
- Dynamic cohorting: The tool allows you to create segments of users by filtering for real time behavior and historical actions. You can combine user activity with user attributes like vertical, contract value, first touch attribution, and more to create complex personas in your analysis.
- Advanced attribution: Heap captures every touch to help you find the channels with the highest return: Tie in touch points like opening email, reading blog posts, or watching videos. Change behaviors, channels, and conversion events on the fly – without developers
Pricing
Heap employs a custom pricing scheme. You can start with their free plan or subscribe to the premium plan at $500+ per month.
3. Statcounter

Features
- Summary stats show you at a glance how many page views, sessions, visitors and new visitors your site has received. View summary stats per day, week, month, quarter or year or for a specific date range or period.
- Detailed Stats give you deeper analysis of your visitor activity with features like Recent Visitor Activity, Visitor Labels, Live Visitor Map, Bounce Rate and much more.
- Growth Plan converts the data collected from your web traffic into actionable insights that help you increase your revenue. The cutting-edge predictive analytics show how your site will perform over time. Industry rankings let you see how your site stacks up against your competitors for traffic, social media, mobile traffic and user experience.
Pricing
The platforms offers both free and paid plans. The subscription plan starts from $5+ a month, depending on the number of monthly visitors to your site.
4. Chartbeat

Features
Inform your editorial strategy and energize your business with:
- Dashboards: Real-time dashboard helps understand how your audience is connecting with your content in the moment – across platforms, channels, and devices. Historical dashboard enables intuitively assess content performance, KPIs, and valuable trends over the long term. Video Dashboard uncovers how video content captures viewer attention.
- Optimization tools: Heads up display to identify top-performing articles, trending stories and how far visitors are scrolling down the page so you can adapt the user experience accordingly. Run headline tests that optimize for reader engagement after the click.
- Reports: Use advanced queries to customize the in-depth report you need. Get auto-generated insights in each report delivered to your inbox everyday.
Pricing
Chartbeat’s custom pricing starts at $7000 per year
5. Kissmetrics

Features
- Segment: Easily define and track your key customer segments based on behavior and understand their growth over time. Instantly get curated data and reports about your key segments to launch new initiatives on time and achieve your goals.
- Analyze: See the entire journey across devices to understand customer behaviors. Ready-to-go reports with all the analytics and insights you need to access at anytime, without sampling or history limits.
- Automate: Target the right customer segments with behavior-based, precise emails that keep customers engaged. Measure campaign impact beyond opens and clicks to truly understand what drive sales.
Pricing
Kissmetrics offers 3 subscription plans ranging from $500 to $850+ per month. For annual subscription users can get as much as 20% off on monthly fees.
6. Woopra
Woopra is a real-time customer analytics service that provides solutions for marketing, product, sales, and service team. It tracks users across devices and digital touch points and provide a comprehensive behavioral profile for each user. With user data and custom reports, businesses can gain a deep understanding of user behavior, measure campaign effectiveness, and optimize the entire customer lifecycle.

Features
Track, analyze and optimize every customer touch point with Woopra’s reports:
- Journey: Combine any set of actions or attributes to visualize how users move through your website, marketing campaigns and product. Uncover each customer’s unique story and quickly respond to behavior, driving engagement and increasing retention company-wide.
- Trend: Discover how key metrics change over time and the attributes that drive performance with Trends Reports. Measure product usage by feature, subscription changes by location, campaign performance by source and much more.
- Retention: Measure how long users continue to take any action or use any product feature. Know if customers continue using your app after signup or come back to make another purchase. Easily uncover at-risk users and discover engaged heroes.
Pricing
The platform has two subscription options — Small Business and Enterprise Edition. Small Business prices range from $0 to $599.95+ per month depending on the number of actions. The Enterprise Edition has custom pricing depending on your business needs.
7. Mixpanel

Features
- Engagement: Easily surface insights on how people are using your products, ask questions about your users and
delivers answers instantly. - Retention: Visualize how often your customers return and engage. Track and measure if the changes you make to your app increase customer retention.
- Funnel: Identify where people drop off so you can increase your conversion rates.
- People: understand who your users are, see what they do before or after they sign up, re-engage them with messages, and dig deep into customer revenue.
- A/B Testing: test your idea and instantly understand the impact.
- Messages: Turn more users into active and loyal customers by sending them smart and automatic messages wherever they are.
Pricing
Mixpanel’s subscription plans range from $0 to $999+ per year.
8. Clicky

Features
- Real-time reports with details: Most reports contain high level of detail on every segment.
- Heatmaps: View heatmaps by page, visitor, or segment.
- Onsite analysis: See how many visitors are on your site and on the page you’re viewing. You can also launch heatmaps from the widget, all without leaving your site.
- Uptime monitoring: Receive alerts when your site goes offline so you can react immediately. Your site’s uptime is monitored from 7 locations around the world.
- Individual visitors and actions: See every individual visitor and page view/event.
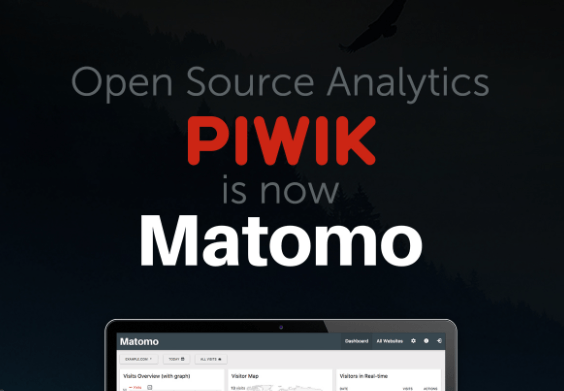
9. Matomo (formerly Piwik)
Features
Pricing
10. Amplitude Analytics

Features
- Taxonomy: Build product trust with data integrity for the centralized analytics team
- Query: Direct data access for custom analytics
- Scale: Access billions of user actions for lightning fast insights
- Portfolio: Analyze engagement across multiple applications with one single view
- Accounts: Accelerate product growth with account level analysis for B2B product insights
- Insight: Smart and automatic alerts for fast product monitoring


